
In vitro characterization

The iPSC-derived microglia were further characterized by reMYND and Imec. reMYND performed functional characterization based on qPCR, phagocytosis and morphological assays. Imec characterized the morphology of the iPSC-derived microglia under label-free conditions.
Functional characterization of iPSC derived microglia
Several assays were implemented to study microglial function of selected cell lines. Microglia were functionally characterized by qPCR, phagocytosis and morphological assays.
- Microglia identity was verified using RT-qPCR using a panel of microglia-specific and macrophase-specific markers. RT-qPCR results showed that several microglial mRNA markers were upregulated in the matured microglia, while stemcell markers were absent.
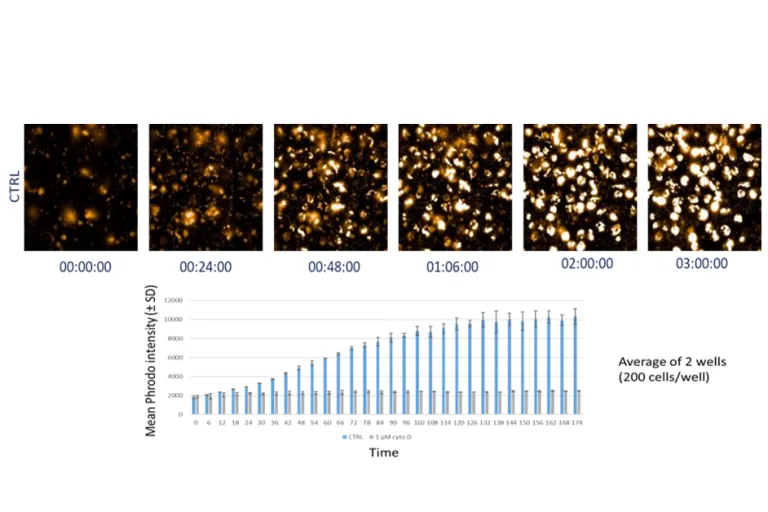
- To test the phagocytic function of the iPSC-derived microglia, the cells were tested for their ability to phagocytose exogenous materials. Microglia were able to phagocytose bacterial like bioparticles and Amyloid oligomers/fibrils (see figure 6 showing the uptake of fluorescently labeled material over time). Bioparticle uptake correlated well with PRS (figure 7) however, this was mainly driven by the highly phagocytosing APOE4/4 carrying microglia.
- reMYND was also able to monitor morphology and motility using live brightfield imaging of microglia. In these assays microglia are individually tracked over time after LPS induced activation. Using machine learning models, phenotypes were characterized and analyzed.
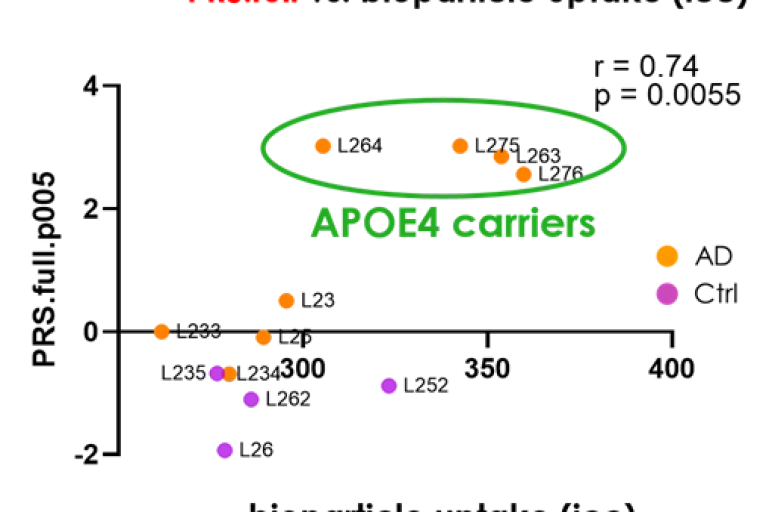
A quantification of the number of fibrils phagocytosed indicated that microglia derived from AD patients phagocytosed more amyloid fibrils than control subjects (figure 7).
Morphological characterization of iPSC-derived microglia
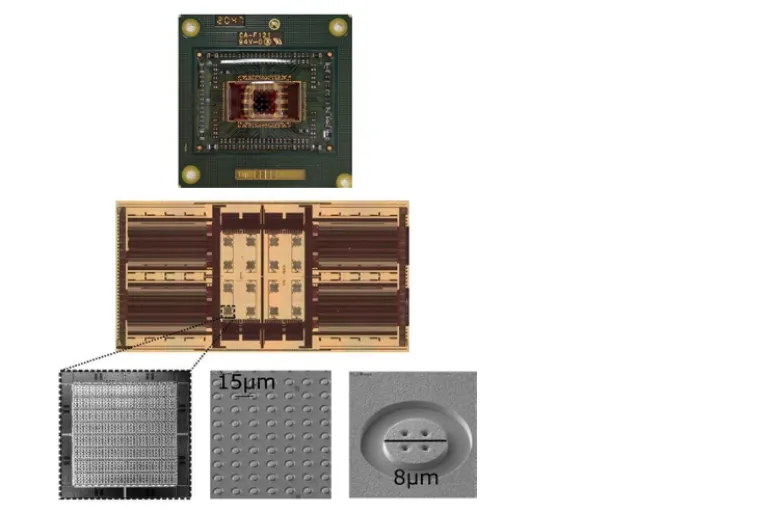
Imec performed in vitro morphological characterization of microglia under label-free conditions using a high-density multi-electrode array to measure the impedance of individual cells. The multielectrode array consists of 16384 electrodes with an electrode-to-electrode distance of only 15 µm (Figure 8).

For long-term impedance monitoring, the measurement system was placed in the incubator to keep the microglia in their optimal environment during recordings (Figure 9). For combined microscope imaging and impedance monitoring, the measuring system was placed on the microscope stage. Moreover, a controlled environment of 37°C and 5% CO2 was created around the microscope.

For each cell line, impedance data is collected at multiple timepoints before and after activation of the microglia with lipopolysaccharide (LPS). A data processing pipeline in Matblab was established to derive motility values from impedance data. The results indicated that addition of LPS results in a decreased microglia motility (Figure 10).
Presentations/Posters
AAIC2022: Genetic background and immunophenotype on microglial response to AD pathology