
Calculation of AD risk scores

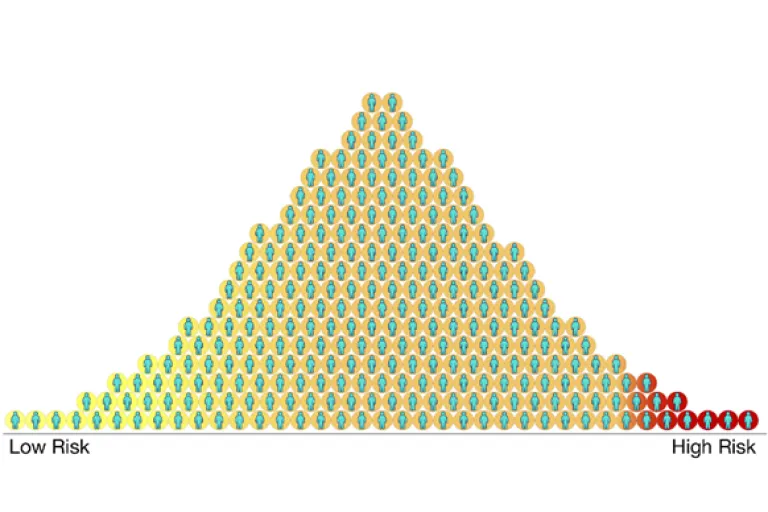
Polygenic risk scores (PRS) are computed by summing the genetic risk variants an individual carries for a specific trait or condition, each weighted by their effect size. A variant that confers a higher risk for a trait thus has a higher weight in the score. Genetics plays an important role in Alzheimer’s disease, with the major risk gene for Alzheimer’s disease being the APOE gene, especially the APOE Ɛ4 allele. Having one APOE Ɛ4 allele doubles or triples the risk of getting AD, having two APOE Ɛ4 alleles increases the risk even more, about eight to twelvefold. Besides this gene, approximately 70 other genetic risk loci were identified using so-called genome-wide association studies. They each confer only a tiny risk for disease, but they can be combined in polygenic risk scores (PRS) which may then be used to estimate an individual’s lifetime genetic risk of disease.
If this is done for a large population set, each score can be plotted giving rise to a Gauss curve (Figure 1). Most people find their scores in/near the middle of this normal distribution curve, predicting an average risk for developing this particular disease. Individuals on the tail sides have a high (right) or low (left) risk.

Different types of PRS
- PRS-AD: using all available SNPs in the genome
- PRS-noAPOE: excluding the SNPs from the APOE region
- PRS-APOEonly: only including the SNPs from the APOE region
- PRS-APOEƐ2Ɛ4: score based on the two main APOE variants (rs429358 and rs7412)
- Combined score of PRS-noAPOE + PRS-APOEƐ2Ɛ4.
These different genetic scores were calculated for all subjects of the two in-house cohorts. However, only the whole-genome PRS scores (PRS-AD) were used in the laboratory-oriented activities and for the investigation of the clinical utility of PRS for AD. Samples were selected for inclusion in the laboratory-oriented activities based on APOE genotype (Ɛ3/Ɛ3, Ɛ4/Ɛ4 and Ɛ3/Ɛ4) and PRS-AD, such that patients are selected from the low and high PRS end.
A significantly higher PRS score was found in the cases (median PRScases= 0.42) compared to the spouse control group (median PRSspouses controls= -0.64) with a wide spread seen in both groups (Figure 2). Furthermore, the APOE carriers have a higher PRS than the non-carriers, which is most pronounced in the homozygous carriers. This is to be expected since APOE is the biggest genetic risk factor for AD.
Development of a PRS pipeline
Within the framework of the PRISMA project, the Laboratory of Complex Genetics (KU Leuven) has built an extensive PRS computation pipeline which combines several PRS tools that each calculate PRS in a different manner, and that automatically selects the best PRS tool and model based on performance metrics (Figure 3). Following tools are included: PRSice-2, Lassosum, PRS-CS and LDpred2. For each tool separately, different parameters can be set. All scores are calculated automatically after providing the necessary input files. The output includes all calculated scores and respective performance metrics; the selection of the best PRS model per tool (based on R² and AUC (ongoing)); and the overall best PRS model. The PRS pipeline will be made accessible for free (github).

Association between different AD PRS and amyloid accumulation
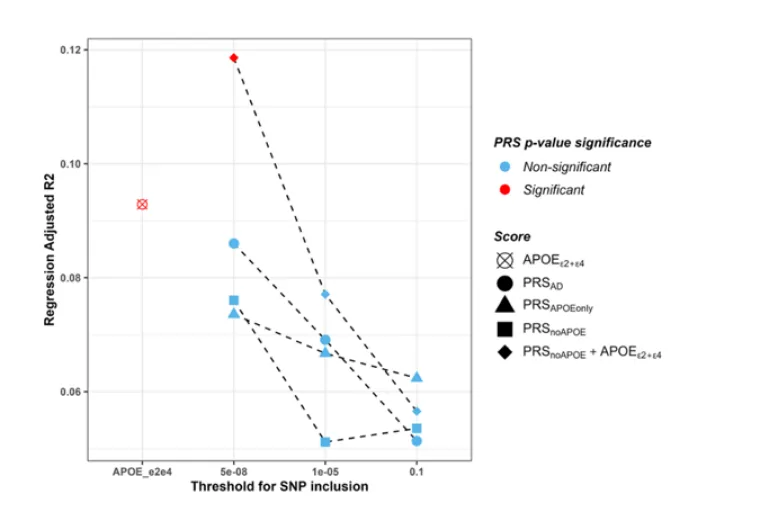
KULeuven in association with UZLeuven investigated the association between different AD polygenic risk scores and amyloid accumulation in the F-PACK cohort. The PRS with and without the APOE region was calculated in 90 cognitively health F-PACK participants with baseline and follow-up amyloid PET. A score based on PRS escluding the APOE region plus the weighted sum of the two major APOE variants (rs429358 and rs7412) was significantly associated with amyloid accumulation (p=0.0126) (Figure 4). The two major APOE variants were also significantly associated with amyloid accumulation (p=0.0496). The other PRS were not significant. This study shows that specific PRS are associated with amyloid accumulation in the asymptomatic phase of AD
Figure 4. The adjusted R2 and PRS p-values for the regression models. The red points represent significant PRS p-values from the regression models (< 0.017 (multiple pT), or < 0.05 (for single score)). The higher the adjusted R2 the higher the variance explained by the PRS on amyloid rate of change in the linear regression model. N = 90
Publications
https://pubmed.ncbi.nlm.nih.gov/36151568
Presentations/Posters:
Abakkouy, Y., Luckett, E., Becelaere, S., Vandenberghe, R., Cleynen, I. (2023). Identifying the best performing Alzheimer’s disease PRS with the aim of risk prediction and the role of age in the genetic architecture. Presented at the American Society of Human Genetics Annual Meeting 2023, Washington, DC, US
Abakkouy, Y. (2022). Polygenic Risk Score: Breaking the wall of predicting Alzheimer’s. Presented at the Falling Walls Lab Finale, Berlin, Germany
Abakkouy, Y., Luckett, E., Vandenberghe, R., Cleynen, I. (2022). Genome-wide and pathway-specific polygenic risk scores in an Alzheimer’s disease case-control cohort. In: https://beshg.be/storage/app/media/Meetings/Abstracts_all.pdf, (Abstract No. P83), (115-115). Presented at the Joint BeSHG / NVHG meeting & Genetics Retreat 2022, Bruges Meeting & Convention Centre, 20 Apr 2022-22 Apr 2022.
Abakkouy, Y. (2021). Polygenic risk scores for Alzheimer’s disease prediction and stratification. Presented at Connecting Science – Advanced Courses + Scientific Conferences: Molecular Neurodegeneration and Therapeutic Approaches – Virtual Event, Hinxton, UK